
TL; TR
Part of our stack runs on Heroku and uses the Heroku provisioned Postgresql services.
The tier 0 and 2 from Heroku Postgres databases have a credit system for Disk Usage. That means that if you use the disk over the IO capacity of the tier, at any point it might drop the performance drastically until you have recovered some credits.
You can find here the detail characteristics of each Heroku Postgres Performance characteristics.
First signs
During most of 2018, we had a series of “hard to explain poor performance events” in one of our databases. Some mornings, the Load Avg of the DB would start growing like crazy for around 1 hour that of course caused the queries and operations to perform much slower bringing the application to almost an unusable level.
The mystery was that there was nothing outstanding:
- The throughput was similar to any other day or moment
- No significant changes in memory usage or cache performance
- No significant changes in IOPS
The main hypothesis was an IO problem, but there was no metric that would support that. From my experience, when the database performance drops drastically across ALL queries without having done any significant change, the most likely reason is that you started using disk instead of memory for certain processes.
With no clue of what was happening exactly, we did some changes:
- Reschedule certain rake tasks to avoid overlapping
- Rewrite certain rake tasks to improve performance
- Increase the TTL of certain counters based on heavy queries
The Load AVG reduced a bit and the platform was less affected, so we decided to live with it.
The nightmare
On the 12th of February of 2019, everything broke up. Early in the morning, we started having lots of timed out requests. After doing some checks we realized that it was the Load AVG problem again and crossed fingers that it would go away in some minutes, but it didn’t.

Like every single time, there was no apparent reason why this was happening. We spent the following 2 days making blind hypothesis and fixing problems which were not the real cause:
- reducing database size
- removing useless indexes
- adding useful indexes
The light at the end of the tunnel
Around noon on the first day, we opened a ticket on Heroku Support. After dodging the first contact person (which provided a useless response) we were redirected to the Heroku Data Team. And from them came the answer:
In regards to CRIMSON, the primary cause is exhausting the burst quota for the primary database disk (ref: https://devcenter.heroku.com/articles/heroku-postgres-production-tier-technical-characterization#burstable-disk-performance). When exhausted, the disk performance is throttled to the baseline, which resulted in significants amount of CPU time spent waiting on I/O operations. We don’t currently alert when you are being throttled during this scenario.
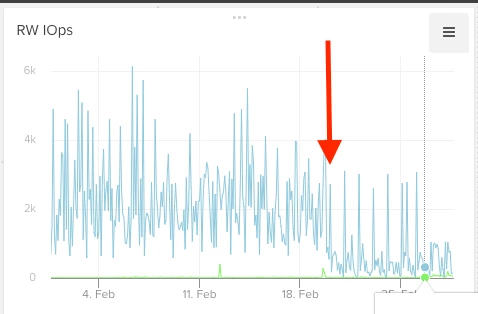
I note that over the last 72 hours on CRIMSON, IOPS were regularly over the baseline for the -2 tier, 750, and in some cases spiking up to ~3190 IOPS. It’s likely you’ll see this form of performance impact again should there continue to be increased disk utilization. You can monitor these stats by consuming the metrics logs (ref: https://devcenter.heroku.com/articles/heroku-postgres-metrics-logs) either directly, or charting these in Librato.
This paragraph from the mentioned documentation is especially relevant:
Each of these plans can burst past this amount of I/O operations per second for a short amount of time. If the database continues to more perform I/O operations per second, then performance is brought back to the baseline PIOPS, which can heavily impact database performance. Both read and write IOPS can be found in the Heroku Postgres Server metrics.
The problem was that the database tier we were using had a credit system that limited the capacity to 750 IOPS. These credits systems are designed based on average consumption.
As an example, if you spend 30 minutes at 500 IOPS and 30 minutes at 1000 IOPS, your average is 750 IOPS and there is no problem. But if you run out of credits, your IO performance just drops to something really terrible, and there is no metric telling you that.
When you check the IOPS of the weeks before the problem you can’t see any indication that we were in a worse situation (neither when looking it in detail)
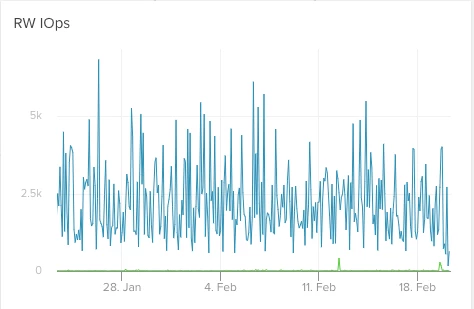
The solution was basically upgrading the DB to a higher tier, which fixed the problem immediately.
Learnings
- Contact support as soon as you have a big problem. They know much better than you how their service works.
- Lots of useful commands from the Heroku Toolbelt:
- heroku ps –app app_name ==> List active dynos, workers, rake, etc.
- heroku pg:ps –app app_name ==> List active processes on main DB
- heroku CLI plugin for PG commands