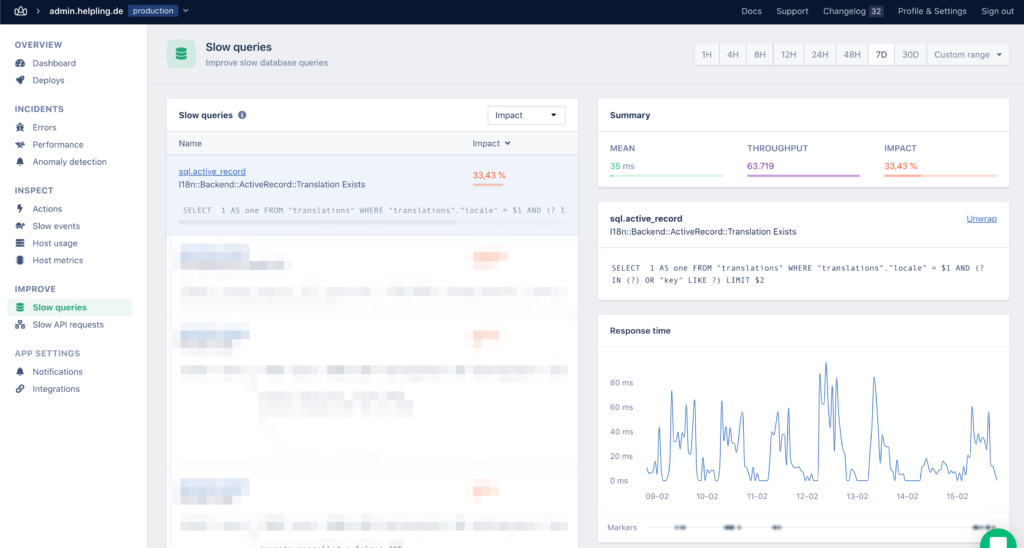
One day a sharp eye of our CTO noticed an interesting metric in our APM tool. He’s found a query that searches through translations table with a big impact on the app performance. The impact was most likely because of the throughput but also the meantime 35ms seemed quite a lot for a table with ~ 20k rows.

Finding the cause
After further investigation, our CTO’s suspicion that the indexes are not used properly has been confirmed. Analysis of the query
EXPLAIN ANALYZE SELECT 1 AS one FROM "translations"
WHERE "translations"."locale" = 'fr'
AND ( "key" IN ('meta_tags.titles.login_page')  OR "key" LIKE 'meta_tags.titles.login_page.%')
LIMIT 1;
returned query plan that was using sequential scan
 Limit  (cost=0.00..377.12 rows=1 width=4) (actual time=16.772..16.782 rows=0 loops=1)
   ->  Seq Scan on translations  (cost=0.00..754.24 rows=2 width=4) (actual time=15.765..15.774 rows=0 loops=1)
         Filter: (((locale)::text = 'fr'::text) AND (((key)::text = 'meta_tags.titles.login_page'::text) OR ((key)::text ~~ 'meta_tags.titles.login_page.%'::text)))
         Rows Removed by Filter: 21385
 Planning time: 0.435 ms
 Execution time: 16.868 ms
After a bit of experimenting, we’ve found out that the problem lies in the usage of LIKE clause with % operator that prevents the ordinary index on the column key from being used. The Postgres documentation says that only databases using standard “C” locale can use indexes for simple left-anchored expressions (the “prefix search”). Our database uses en_US.utf8 which is the reason why the index is not used.
Solution
Postgres provides a way for us to specify what operator class should the index use. A built in operator class varchar_pattern_ops tells the index to compare values strictly character by character rather than according to the locale-specific collation rules.
In Rails we can create the index using the following migration:
def change
  add_index :translations, [:locale, :key],
    opclass: { key: :varchar_pattern_ops },
    name: 'index_translations_on_locale_and_key_prefix'
end
Analysis of the same query now shows query plan using Index scans without any sequential scan:
 Limit  (cost=8.85..10.86 rows=1 width=4) (actual time=0.171..0.179 rows=0 loops=1)
   ->  Bitmap Heap Scan on translations  (cost=8.85..12.87 rows=2 width=4) (actual time=0.153..0.160 rows=0 loops=1)
         Recheck Cond: ((((locale)::text = 'fr'::text) AND ((key)::text = 'meta_tags.titles.login_page'::text)) OR (((locale)::text = 'fr'::text) AND ((key)::text ~~ 'meta_tags.titles.login_page.%'::text)))
         Filter: (((key)::text = 'meta_tags.titles.login_page'::text) OR ((key)::text ~~ 'meta_tags.titles.login_page.%'::text))
         Rows Removed by Filter: 33
         Heap Blocks: exact=4
         ->  BitmapOr  (cost=8.85..8.85 rows=1 width=0) (actual time=0.076..0.084 rows=0 loops=1)
               ->  Bitmap Index Scan on index_translations_on_locale_and_key  (cost=0.00..4.42 rows=1 width=0) (actual time=0.032..0.038 rows=0 loops=1)
                     Index Cond: (((locale)::text = 'fr'::text) AND ((key)::text = 'meta_tags.titles.login_page'::text))
               ->  Bitmap Index Scan on index_translations_on_locale_and_key_prefix  (cost=0.00..4.42 rows=1 width=0) (actual time=0.017..0.058 rows=33 loops=1)
                     Index Cond: (((locale)::text = 'fr'::text) AND ((key)::text ~>=~ 'meta'::text) AND ((key)::text ~<~ 'metb'::text))
 Planning time: 0.310 ms
 Execution time: 0.365 ms
The query planner now uses index_translations_on_locale_and_key_prefix to effectively fetch a range between values meta and metb using operators ~>=~ and ~<~ . The subsequent Bitmap Heap Scan then rechecks all values with ~~ operator and filters out 33 rows that were included in the range but did not match the expression from the query. It’s a significant improvement from 21385 rows that have been removed by the filter in the Sequential scan.
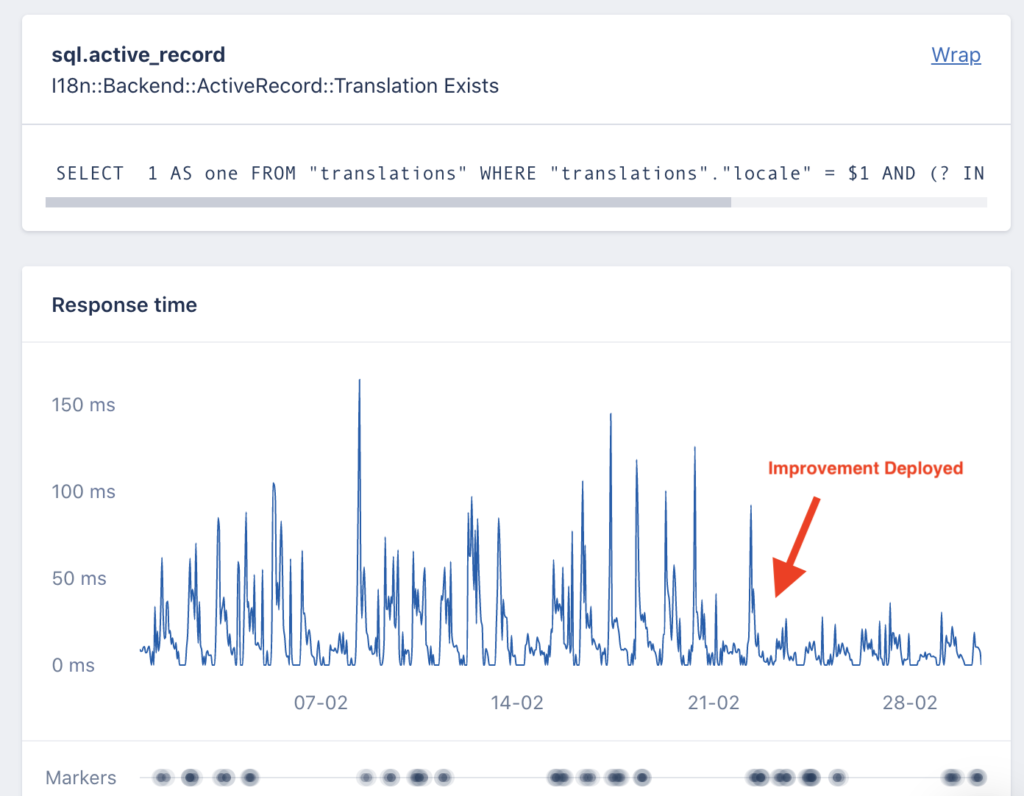
The execution time for this particular query dropped from 16.868 ms to 0.365 ms but most importantly, we started seeing the improved performance in the APN right after the deploy.

Conclusion
Using indexes is a great way to speed up queries, but the proper use of them is necessary for the true benefits to be present. In the agile development workflow, we have at Helpling, it’s impossible to deeply analyze the impact of every query we implement. That’s why it’s important to have good Application Performance Monitoring (APM) tools set up that provides us with the insights we need.
